Ask what the market is doing
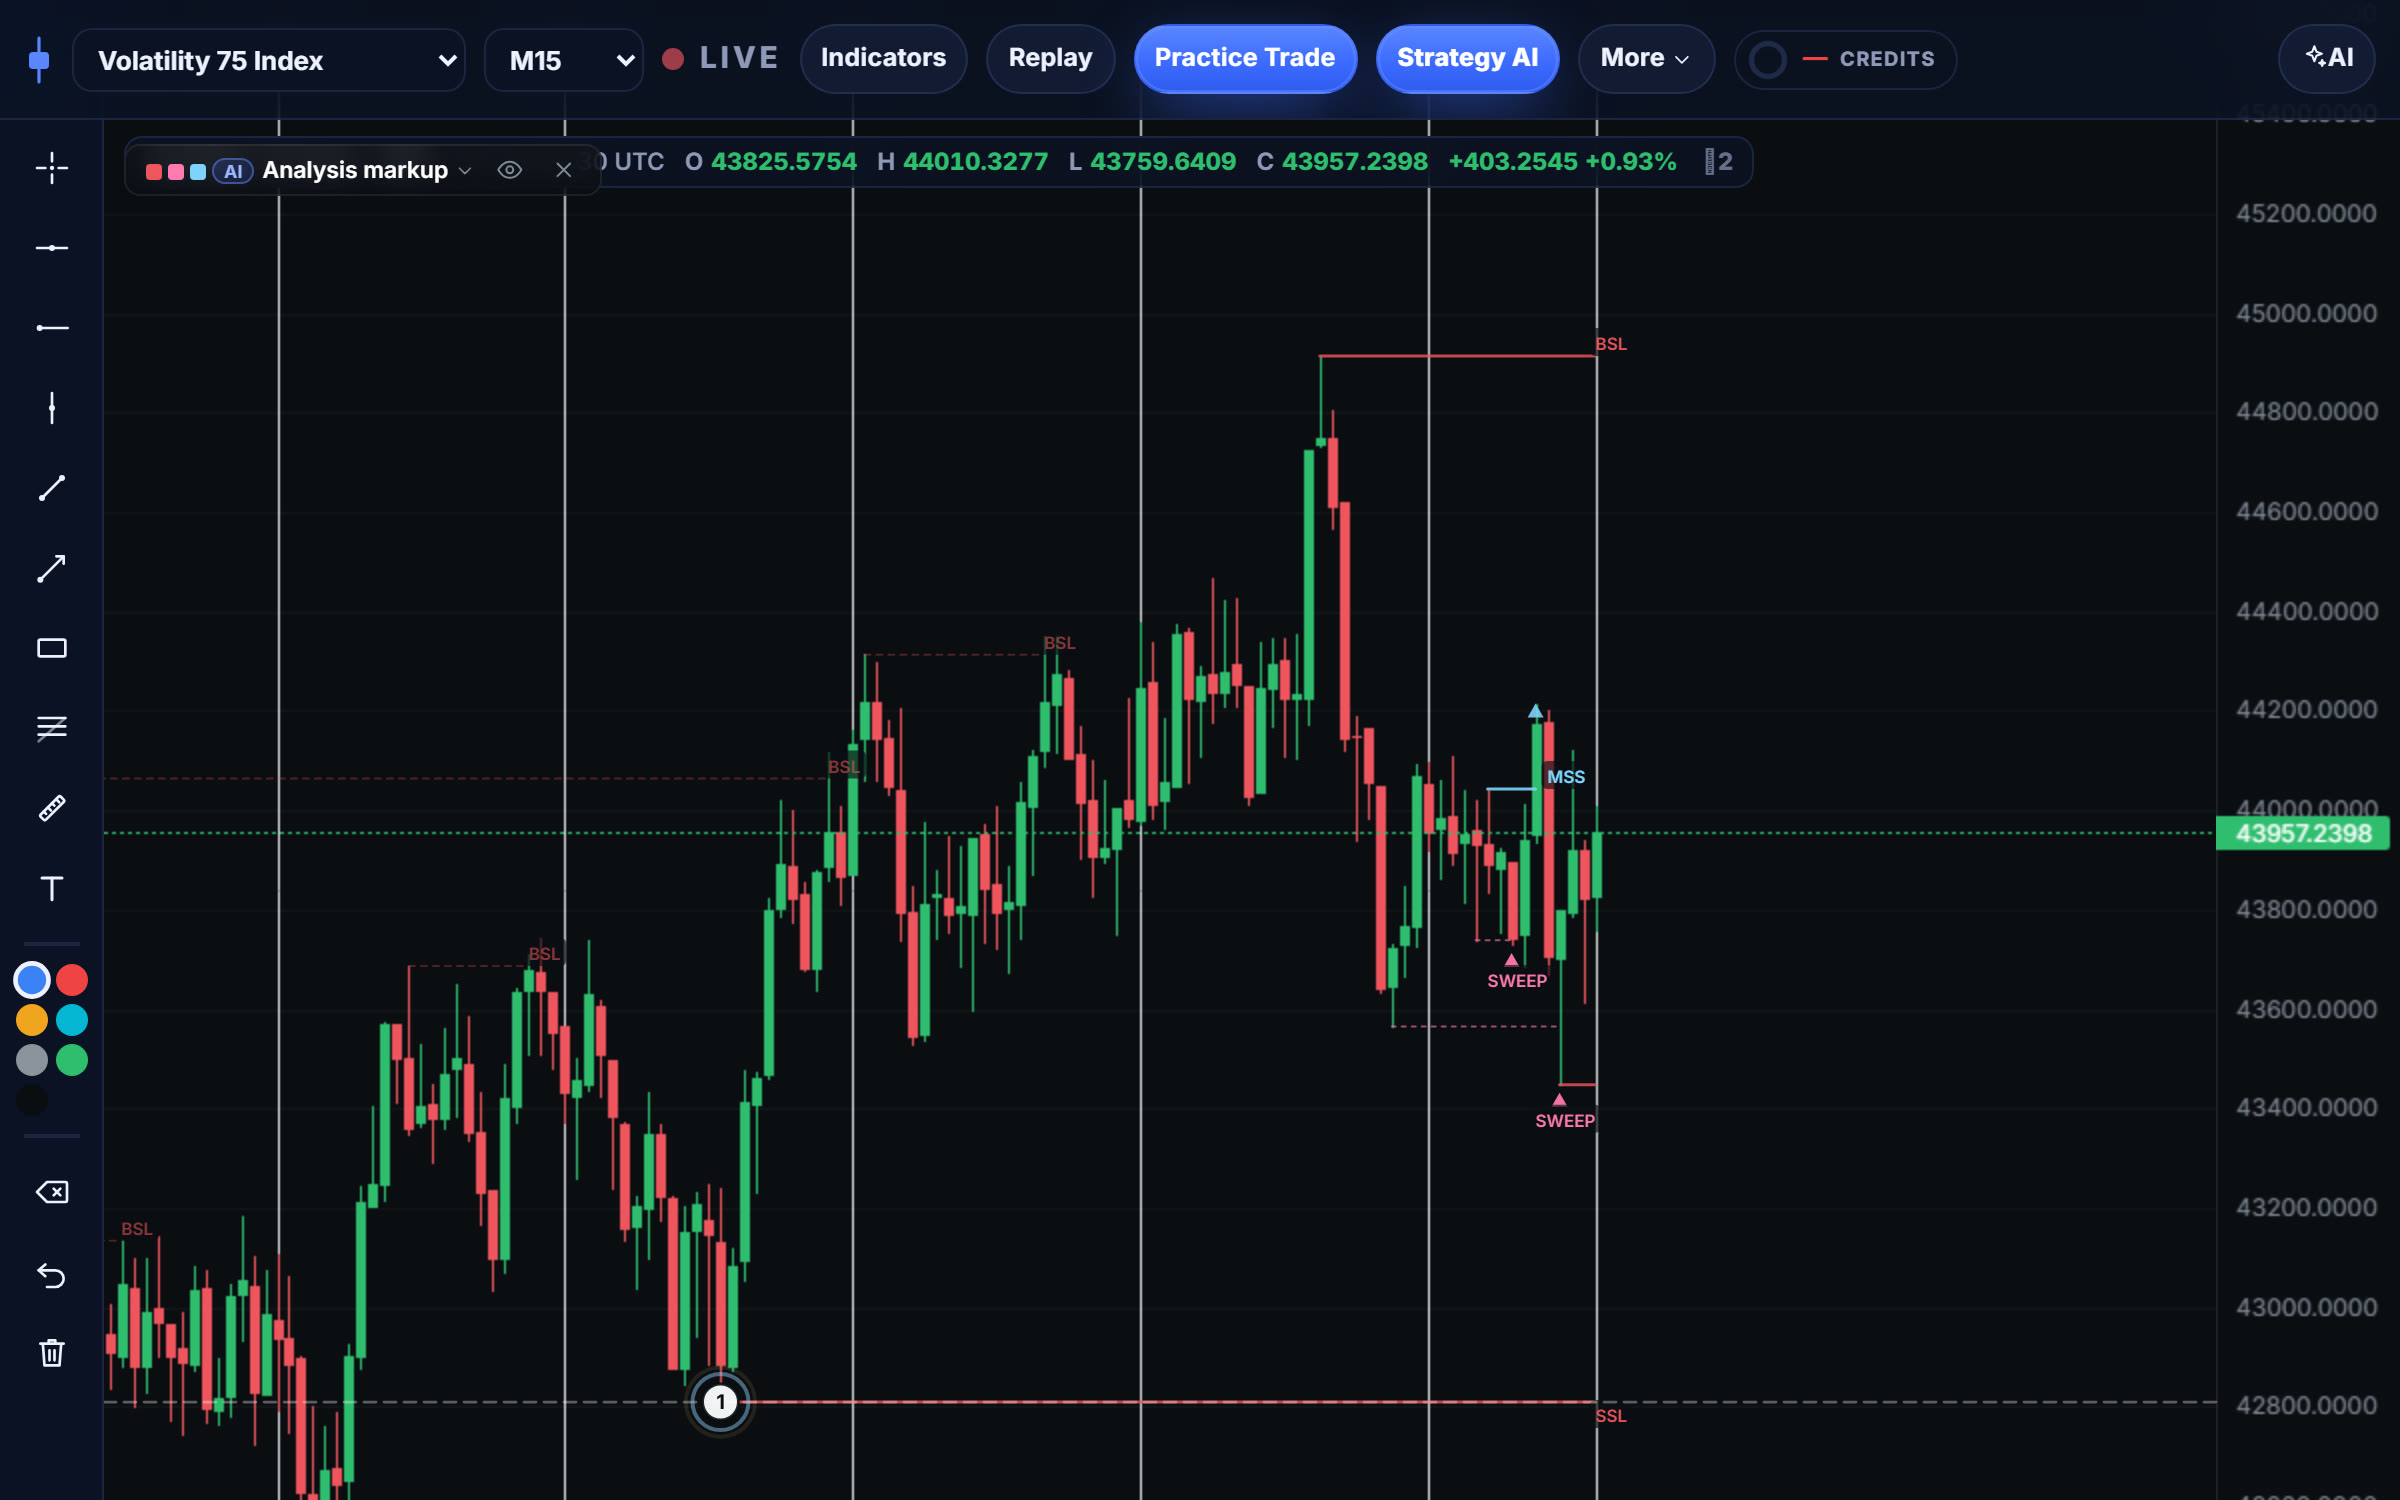
The AI reads the open chart, draws the levels it talks about, and walks you through them out loud. Ask a follow-up and it carries on from the same read.
Rewind the market with the future hidden, let the AI read the chart with you, and test any strategy on real Deriv data before you risk a cent. V75, Boom, Crash and 40 more synthetics, plus forex, gold and crypto, in your browser.
46 synthetic indices, 25 forex pairs, 4 metals, 3 US indices and 2 coins.
All in one chart, every one replayable candle by candle.
Most traders find out a strategy does not work with real money. Wickproof lets you find out first: replay the market candle by candle, practise every trade at the risk you choose, and test the rule on months of real data before it ever touches your account.
Built around the Deriv synthetics the generic platforms never cared about, with forex, gold and crypto alongside.
The AI reads the open chart, draws the levels it talks about, and walks you through them out loud. Ask a follow-up and it carries on from the same read.
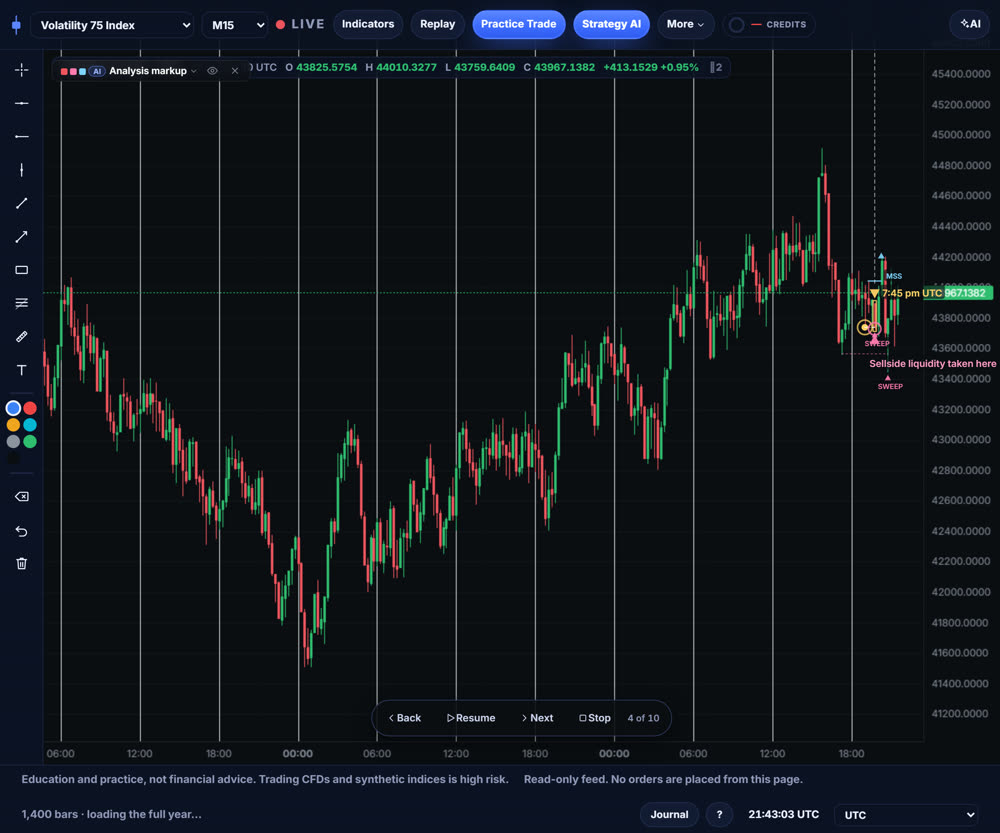
Step through the market candle by candle, or tick by tick, knowing only what you would have known at the time. No hindsight leaking in.
Pick a risk percentage and the ticket sizes the position from your stop. Each result lands in your journal in R and dollars, with expectancy first, never win rate alone.
Write a strategy in plain words. The AI turns it into a rule, and the tester runs it across 112 stop and target combinations, scoring older and newer history apart.
How the testing works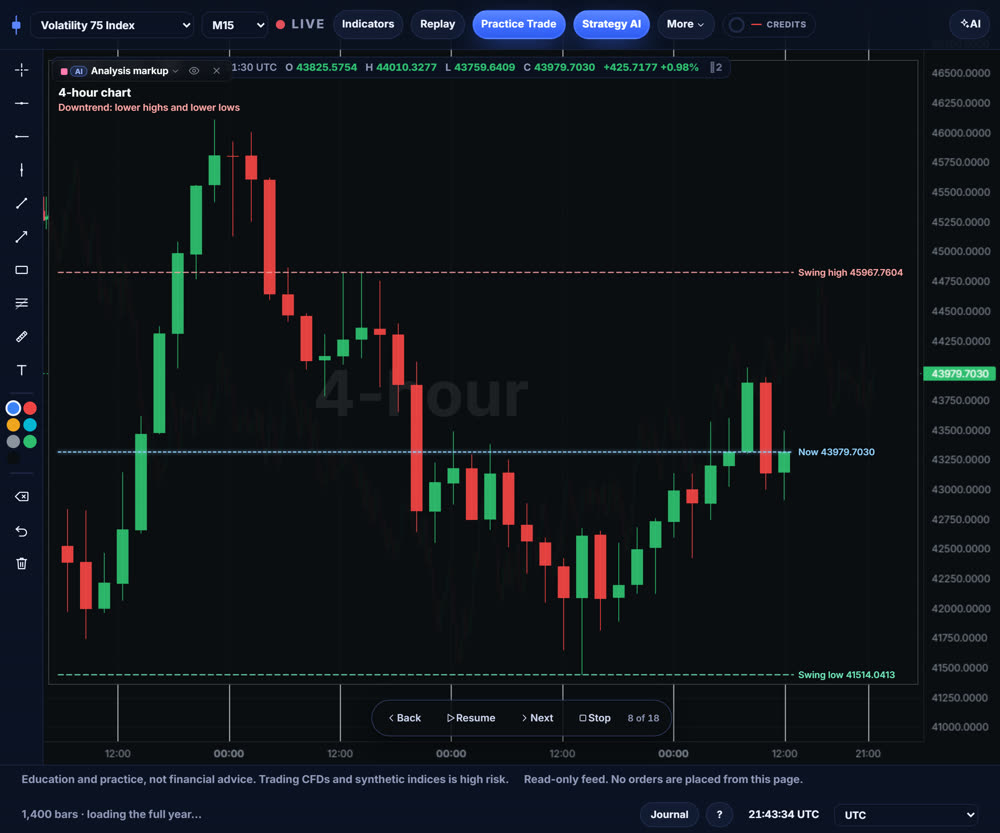
One button reads every timeframe from the weekly down, says where they agree and where they fight, and shows each one on the chart as it speaks.
A scalp read checks the spread against the size of a 1-minute candle and says plainly when the market is too choppy or too costly to bother.
Every number in Wickproof comes from real candles, and the bad results are shown as plainly as the good ones.
Share a strategy's real test result on its own page: the rule, the parts that could not be tested, and how it did.
A practice and testing tool, not a promise of profit. What it changes is how fast you learn.
Set a level or a setup and get told on Telegram when it happens, with a link straight back to the chart.
Equity curve, daily bars, a monthly calendar and expectancy front and centre. Never win rate alone.
Nothing to install. The chart, the AI and replay run in the browser, phones included.
No installs, no MT5 setup, no downloads.
The chart dims and a line follows your mouse. Click where you want history to start.
Pick a risk percentage. The ticket sizes the position from your stop and shows the estimated loss.
The market unfolds bar by bar. Your result lands in the journal in R and dollars, automatically.
Straight from Deriv's public data feed. Nothing to connect, and we never ask for your broker login.
Volatility, Boom, Crash, Step, Jump, open all week
EUR/USD, GBP/USD, USD/JPY and more
Gold, silver, platinum, palladium
US 500, US Tech 100, Wall Street 30 (CFDs)
BTC/USD and ETH/USD, open all week
Every account starts with a 7-day Pro trial, free, no card: every feature, plus 5 AI credits to try the AI. After that, pick a plan or stay on Free.
What's a credit? 1 AI credit = 1 AI request: a chart read or drawing in the AI chat, or a strategy built and tested in Strategy AI (Pro, Premium and the trial). Credits reset on the 1st of each month.
This is a practice and testing tool, not a promise of profit. The AI describes the chart and lays out the scenarios; it never tells you to buy or sell. The tester marks setups as candidates, never verdicts. The journal leads with expectancy because win rate alone is how traders fool themselves. Most retail traders lose money, and no software changes that by itself. What it changes is how fast you learn.
The things people ask before they sign up, answered plainly.